Decision Intelligence · Institutional scale · Auditable AI

Hard decisions, turned into models you can interrogate.

Twenty years restoring trust in the data behind UN-scale decisions. Now: a council of AI models I direct, and evidence anyone in the room can open. Every case on this page is live. Change the criteria and reach your own verdict.

For boards, executive committees and organisations appointing their AI leadership.

↓  see a live decision engine running inside this page
Scale · verified
160+ country offices · USD 2.5B a year
4 AI models · one human verdict
Travel Shockwaves · live engine

Live proof. Not a screenshot.

A live preview of the engine itself, built to the same brand, running inside the page. Hover to bring it to colour, drag the controls, navigate four views.It comes to colour and moves on its own, use the arrows to change views. The full instrument opens in one click.

LIVE PREVIEWTravel Shockwaves · interactive engine Open full engine ↗
An interactive data essay

TRAVEL
SHOCK
WAVES

Tourism does not simply bounce back. It mutates. An engine for how shocks stop, compress, reroute and reshape global travel.

1.52BArrivals 2025
−72%2020 Collapse
60MChina Gap
138%M.East vs 2019
35MDigital Nomads
Global arrivals · 2000–2035 1.52B 2025
0005101520253035
Shock signatures · 4 types · 5 dimensions
DSpDuReLe
STOP · Health
COMPRESS · Economic
REROUTE · Geopolitical
MUTATE · Climate
Atlas · global shockwave map
Watch shocks reshape the map.

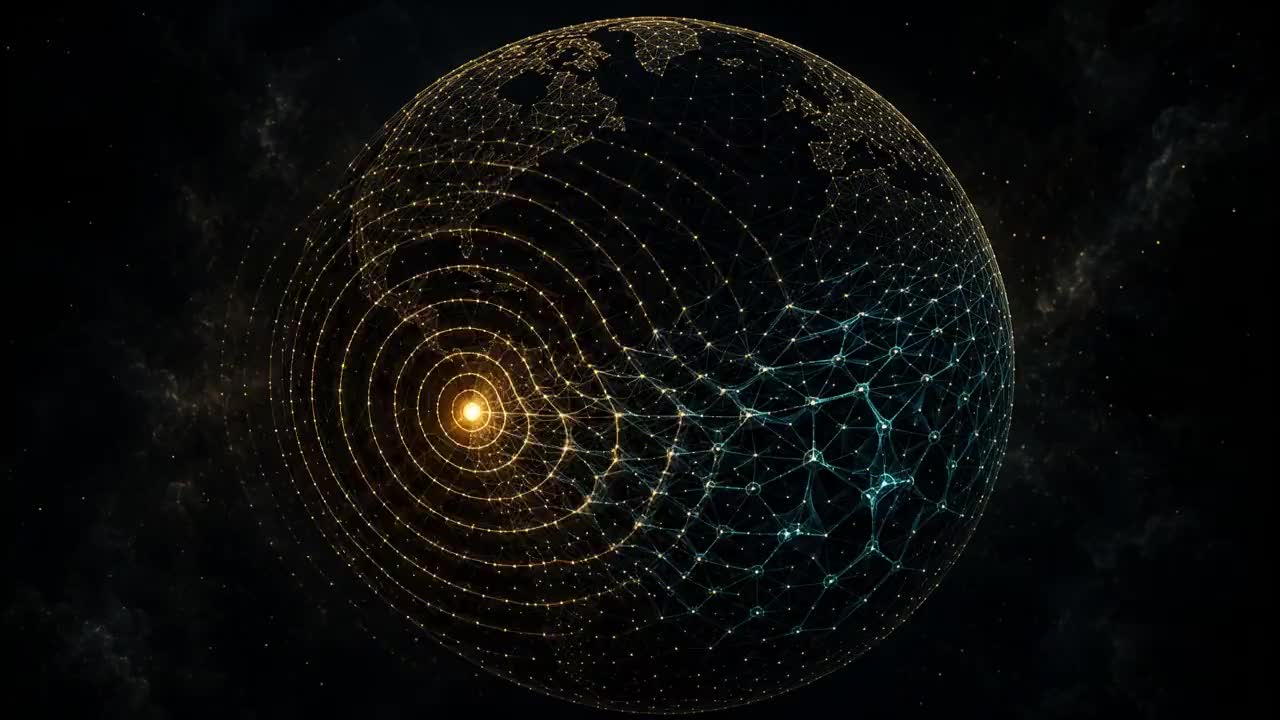
Health stops flows · economic dims them · geopolitical bends them · climate erodes them. Pick a lens, the globe responds.

Shock lens
Shock signature · the DNA of disruption
Depth
0
Speed
0
Duration
0
Rebound
0
Legacy
0
Recovery Race
Who bounced back first?

A race is easier to understand than a dense table. Press play and the regional divergence becomes immediately visible.

2019

All regions collapsed in 2020 (−72% globally). Asia-Pacific deepest at −84%.

✈ Data Film
12 seconds that explain 25 years.

An animated data narrative, no commentary needed. Press play and let the numbers tell the story.

Screen 01 / 04 · Overview
hover to bring it to life · everything moves on its own · take control anytime
The Civilisation Lab · evidence specimen

Two doors, one comparison.

A second instrument under the same evidence discipline, but on a different time horizon, and a different surface. Below: the engine itself, live, interactive, yours to explore.

193nations
·
150years · 1900 → 2050
·
25indicators
·
4paths to begin
LIVE ENGINEThe Civilisation Lab · interactive hover to colour · drag the year · pick a theme
Open the Civilisation Lab engine ↗

Same evidence discipline as Shockwaves. Separate canvas. Ships as a standalone engine.

01

One promise, verified twice.

Most analysis asks you to trust two things you can't see: that the data is sound, and that the reasoning is sound. I make both inspectable, before a decision is made on either.

Most decisions don't fail at the strategy. They fail at data nobody could trust, and reasoning nobody could check.

At a major UN agency, reconciling 500,000 procurement lines by hand took two months. The same first reconstruction pass now takes a day, complex domains then iterate from there. That speed isn't the product; it's what makes the rest possible: once the foundation is sound, I rebuild it into something a board, or a regulator, can defend.

2 months → 1 day*
first-pass data reconstruction, 500k rows, 50 columns, by hand then with method · *complex domains iterate further evidenceSourceUN agency procurement remediation · ERP reconstruction (first-hand)TierOfficial
Reasoning trust

Council of Models

Several AI models as a challenge panel, not one source of truth. They disagree, stress-test each other, and surface the blind spots. Human judgement is the synthesis layer.

Data trust

Turbo Reset

Chaotic, unreliable data rebuilt into a clean, structured, auditable foundation in a day, with every value traceable to source, tier and confidence.

02

Two doors, one standard of rigour.

Validated by how the best information-design studios separate their practice: an intelligence line and an experience line, under one roof, one method.

Door 01 · Advisory

Intelligence Advisory

AI governance & defensible decisions

Council-of-Models assessments, EU AI Act and ISO 42001 readiness, risk classification, and decision frameworks senior leaders can stand behind under scrutiny.

  • Council of Models
  • EU AI Act
  • ISO 42001
  • Decision governance
Door 02 · Studio

Interactive Intelligence

Visual decision instruments

Executive dashboards, evidence maps and data-driven narratives, interactive products a board can touch and interrogate, not slide decks they skim and forget.

  • Live dashboards
  • Data storytelling
  • Evidence drawers
  • Scenario tools
Studio · Visual direction

Five engines, one analytical discipline. Each built as a self-contained instrument, the visual system is the method made visible.

Travel Shockwaves engine
Travel Shockwaves
The Civilisation Lab engine
Civilisation Lab
The Fragility Lab engine
Fragility Lab
World Cup Memory Machine modules
World Cup Memory
Atles dels Castells
Atles dels Castells
03

Decision Tests.

Each case is a decision somebody had to make, rebuilt as a model you can play with. Move the criteria, open the evidence behind any number, and see whether the recommendation still holds. The arc is always the same: the noise, the council, the human criterion, the visual verdict.

CoreDecision products for institutions: built to survive a board, an auditor and the next shock
you are the health minister · set the budget · watch the system respond
Health Systems Intelligence Live

Health Systems Are Decision Systems

From a global budget to a single human life, health is the sum of decisions.

A scroll-driven piece in six chapters. You pick a country, hold its health budget and move the money; the ecosystem of funders, ministries and communities responds live, and the Lusaka Agenda shifts light up only when your choices actually move the system.

FOR
ministries · funders · global-health boards
+
The Challenge
The noise

Where a child is born sets a thirty-year gap in life expectancy before a single choice is made. Global health has no shortage of actors or effort; money, incentives and accountability simply flow in different directions, and only about a third of the signal in raw data ever reaches a decision intact.

The Orchestration
The council

Public health, financing and outcome data reconciled into one model, then challenged by four AI models for gaps and overclaiming before any chart was drawn. The Lusaka Agenda's five official shifts are wired into the budget so the reader can test them, not just read them.

The Human Criterion
The decision layer

Which decisions matter is a judgement from fifteen years inside these institutions, not a statistic: the piece names where leverage sits, from vertical programmes to primary care, from clinic to city design, and refuses to average what is not the same.

The Verdict
The signal

Allocate a USD 3.2B budget and watch equity, resilience and sustainability move. Drag a community toward isolation and read the risk in cigarette-equivalents. Redesign a city and see which real place it resembles. Every chapter ends with the same question: what would change your mind?

150 country offices · USD 3.25B · 160,550 purchase orders · synthetic data
Operational Intelligence Prototype · live

Paretum

Clean before you count. See the portfolio, not the transactions. Find what to buy together.

An independent decision and assurance layer on top of procurement exports. It reads approved exports from any ERP, reconciles suppliers and categories, shows where the data is uncertain, and finds consolidation and joint-buying opportunities across offices and agencies. Runs on synthetic demonstration data.

FOR
procurement leadership · oversight and audit · country teams
+
The Challenge
The noise

A network of 150 offices ordered USD 3.25B through 160,550 purchase orders in a year; 54% of them are under USD 5k and carry 5% of the value. Standard BI shows the transactions. It does not say where to look first, or which number can be trusted.

The Orchestration
The method

The spend-mapping and office-clustering method I built by hand inside a global institution from 2012, rebuilt with AI as an agency-neutral engine: a five-mark scorecard (fit, efficiency, price, resilience, local economy) against 150 peers, with every finding opening its chart, its table and its method, in that order.

The Human Criterion
The decision layer

Everything is shown as a signal to review, never as a finding. Forecast and realised savings are never added together. The controller decides; the system ranks and shows its rule, so the decision can be defended to an audit committee later.

The Verdict
The signal

Start from the network, an office or a theme, pick a year and compare against the five bureaus. Three things stand out against peers; everything else is in order. Built for the question oversight actually asks: where should we look first, and why.

Multi-AI council · Evidence Drawer · live engine
Stress-Test Intelligence Live demo

Travel Shockwaves

Tourism doesn't bounce back, it mutates.

An interactive intelligence engine for how health, economic, geopolitical and climate shocks reshape global travel, 2000 to 2025.

FOR
CROs · boards · destination economies
+
The Challenge
The noise

Arrivals returned above the 2019 peak, so the story looked like recovery. The trap: volume came back, behaviour didn't. The real question isn't how much travel recovered, but what broke and stayed broken.

The Orchestration
The council

ChatGPT, Gemini and Grok produced independent versions for comparative review, structured disagreement, not one source of truth. Claude held the architecture and ran visual validation before deploy.

The Human Criterion
The decision layer

The thesis, tourism doesn't bounce back, it mutates, is a judgement, not an output. Every claim is tiered by hand: Official, Derived or Proxy, with a confidence score the viewer can inspect.

The Verdict
The signal

Eight linked modules let a decision-maker do, not just read, and open the Evidence Drawer on any claim to see its source, tier and confidence. Nothing asks for blind trust.

193 nations · 1900–2050 · one surviving trajectory
Stress-Test Intelligence Live engine

The Civilisation Lab

Which national trajectories actually survive long-range pressure?

A laboratory for asking complex questions of 193 nations across 150 years, pick any two of twenty-five indicators and watch the answer move from 1900 to 2050.

FOR
boards · ministries · foundations
+
The Challenge
The noise

193 nations, 150 years, 25 indicators across incompatible sources. Most development stories cheat: one chart that confirms the author's prior, frozen and called a trend. The trap is the single axis.

The Orchestration
The council

Dozens of authoritative datasets ingested through an automated pipeline and reconciled into one model: 194 countries × 25 indicators × 150 years. Every weaker indicator is flagged, not hidden.

The Human Criterion
The decision layer

Twenty-five indicators is a curation, not a dump. Secondary sources are marked, and every projection to 2050 is labelled projections, not commitments. Showing where data is modelled is the judgement.

The Verdict
The signal

Ask your own question of 150 years of data, press play, and inspect every indicator's source and coverage in Methodology & Sources, and know exactly how much each answer rests on.

4 parameters · 100 scenarios · holds or breaks
Stress-Test Intelligence Live demo

The Fragility Lab

When does a strong recommendation stop being fundable?

An interactive essay on what would change our mind about a strong global-health recommendation, and whether we'd notice in time.

FOR
funders · foundations · boards
+
The Challenge
The noise

A 4.8× recommendation looks robust on paper. Then reality intervenes, and the biggest number is often the one whose model is most wrong in your favour. The optimizer's curse.

The Orchestration
The council

Each of four parameters is estimated from imperfect evidence. The tool runs a hundred scenarios and maps the entire parameter landscape, the disagreement between the optimistic number and the realistic spread is made visible.

The Human Criterion
The decision layer

Knowing where a model breaks in the field isn't in the model. Twenty years across major UN agencies, procurement, supply chain, public health, is what flags the fragile assumption first.

The Verdict
The signal

Drag four sliders and watch a recommendation flip between Holds and breaks in real time. A funder sees, before committing, exactly which assumptions their confident number rests on.

Rangethe same method, proven on subjects people love
1930 → 2026 · ninety-six years · told as evidence
Executive Storytelling Live · 8 modules + 2 games

World Cup Memory Machine

Every number labelled, no averaging into a fake total.

Ninety-six years of the World Cup, 1930 to 2026, told as data, story and play. Eight interactive modules, two games, zero dependencies.

FOR
CMOs · brands · investors · public audiences
+
The Challenge
The noise

Ninety-six years, results, hosts, economics, governance scandals, carbon, scattered across primary documents and contested estimates. Most tellings quote one tidy cost that averages a stadium bill and a national infrastructure programme as if they were the same thing.

The Orchestration
Source discipline

Here the orchestration is of sources, not models. Every figure checked against primary documents. FIFA accounts, the Parliamentary Budget Officer, DOJ indictments, Our World in Data, and carried at its true confidence. Four tiers: Official, Estimate, Modelled, Snapshot.

The Human Criterion
The decision layer

The discipline is refusing to average things that aren't the same. The 2026 carbon footprint is shown as a range, no official figure exists. The uncertainty is part of the story, not an embarrassment to smooth over.

The Verdict
The signal

The flagship, The Ledger, asks who really pays, every figure sourced and labelled. Alongside it: Global Atlas, Outlier Hunter, The Mirror, a 3D Penalty Shootout. Proof the method scales into a beloved subject, and still refuses fake precision.

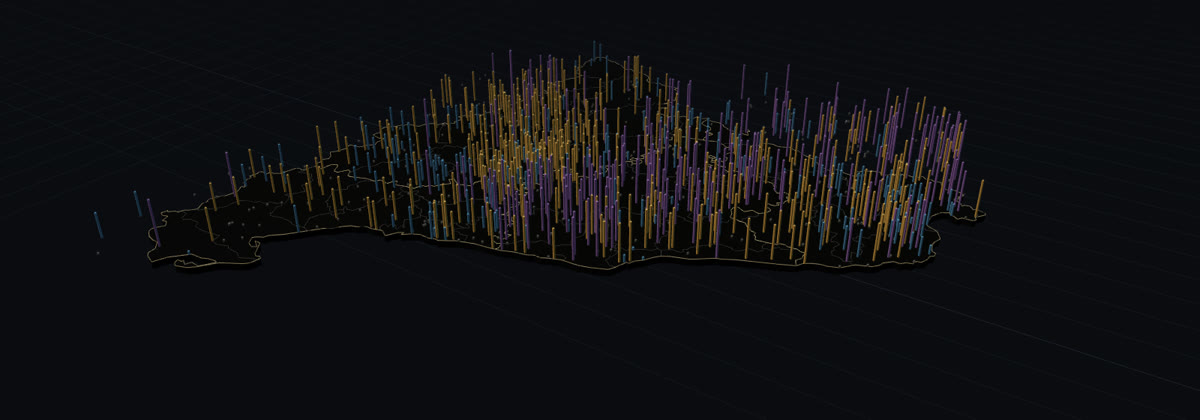
1,453 castles · 800 to 1900 · drag the year and watch the frontier move
Interactive Storytelling Live

Atles dels Castells

A thousand years of fortresses, read as a record of who held what, and when.

An interactive atlas of the 1,453 documented castles of Catalonia. Press play and the map fills from the year 800 to 1900: the frontier of the year 1000, the Carolingian, Romanesque and Gothic waves, and the share of the territory within reach of a castle at any date.

FOR
public audiences · heritage bodies · the curious
+
The Challenge
The noise

Hundreds of sites across inconsistent registers, many of them ruins, a share of them private. Lists existed; a way to see the pattern of a thousand years on one map did not.

The Orchestration
The pipeline

Heritage registers and open geodata reconciled into one dataset, dated and tiered by source quality, with 412 sites marked as still to investigate rather than placed with false precision. Zoom out and the same engine shows 29,660 castles across 39 countries.

The Human Criterion
The decision layer

What to show by default is the curation: documented sites lead, uncertain ones are flagged, and the computed coverage (19.6% of the territory within 15 km of a castle in 840, 98% by 1240) is labelled as an estimate.

The Verdict
The signal

Proof that the method travels. An audience with no interest in procurement explores evidence the same way a board does: change the century, the style or the map, and watch the territory answer.

04

Twenty years of decisions at institutional scale.

The rigour the largest international institutions demand, applied to the data their senior decisions actually depend on. This is the track record the AI work stands on.

Major UN Agency10 years
Procurement & expenditure analytics across 160+ countries and ~USD 2.5B a year evidenceSourceInstitutional financial records · 160+ country officesTierOfficial. Remediated hundreds of millions in misclassified data, restoring audit and decision confidence.
UN Agency. SupplyDirector's Office
Global procurement strategy; an automated dashboard methodology deployed across 145 countries and 27 categories. ~USD 6M annual savings.
UN Agency. HealthBI Project Lead
A standardised scoring and benchmarking framework across 53 country offices, restoring cross-country comparability during organisational change.
The LEGO GroupSenior Data Analyst
Forensic scrap analysis across five global factories, separating signal from noise in high-volume production data for manufacturing leadership.
Capgemini UKPresent
Senior individual contributor in decision intelligence, data strategy and AI readiness, restoring decision clarity where ownership and reporting were fragmented.
04b

Generative & visual direction.

Every image on this site is generated and art-directed in-house, one coherent visual system, never stock. A long generative practice that predates the current AI wave.

Brainstorming, generative loop · 2020
Gold field study
Organic form
Explosion shards
Mountain formation
Grid
Lattice

Selected experiments · 2019– · art direction, generative practice, NFT-era archive. Available on request.

05

Carta Blanca Labs.

Where the method meets the edges. Games, atlases, languages and experiments, each one a test of whether evidence can be made explorable for people who never asked for a dashboard.

Before the Council of Models

Before the live engines.

The same discipline, applied by hand, at institutional scale.

One hundred and fifty country offices. Two hundred procurement categories. Half a million rows of transactional data per fiscal year, cleaned and reconstructed by hand. The output: 350 analytical reports annually, 150 risk matrices, 14,000 strategic scenarios, all from Excel, all pre-AI. From spend mapping came clustering; from clustering came the strategic guidance that oriented procurement across an entire global institution. The instrument was Excel. The patterns it surfaced became the method that ships today.

30,000cells mapped
·
500krows cleaned / year
·
350reports / year
·
14,000scenarios generated
·
0lines of AI
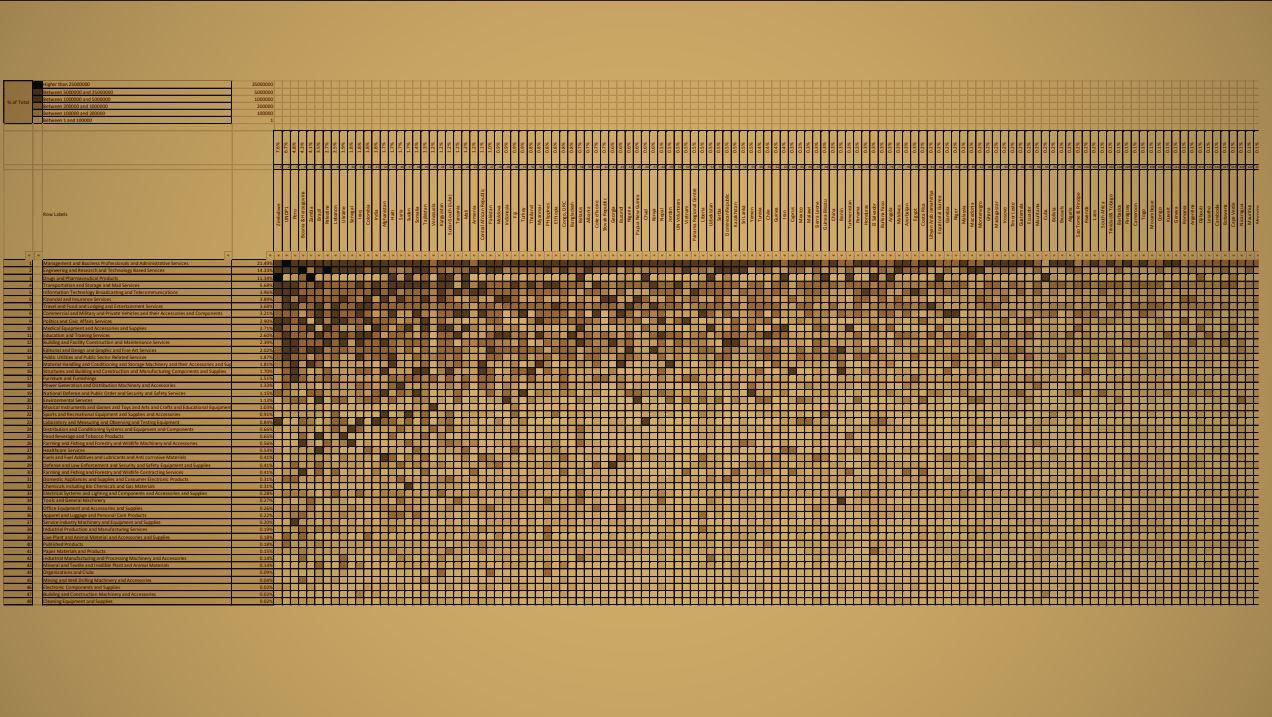
SPECIMENGlobal Spend Heatmap · Countries × Categories~2017 · Excel
Global procurement heatmap
Y~150 COUNTRIES
X~200 CATEGORIES
◆12% OF COMBINATIONS = 94% OF ALL PROCUREMENT

the clustering origin · sorting by value concentration revealed that a small fraction of country-category pairs contained nearly all institutional spend

SPECIMENSupply Positioning Risk Matrix~2018 · Excel
Supply positioning risk matrix
SSPECIALISED · low spend, high risk
CCRITICAL · high spend, high risk
RROUTINE · low spend, low risk
VVOLUME · high spend, low risk

39 categories mapped by expenditure × business risk · the strategic layer that oriented country-office procurement decisions · 150 matrices per year

SPECIMENSpend Mapping · Overview Dashboard~2018 · Excel
Spend mapping overview dashboard
01DATA SUMMARY · PO value ranges
02VALUE DISTRIBUTION · % POs vs % spend
03GEOLOCATION · local / regional / global
04TRENDS · multi-year · POs and spend

four interrelated quadrants in one view · data summary, value distribution, procurement geolocation, multi-year trends · 350 reports like this, annually

The discipline precedes the AI. From spend mapping came clustering, from clustering came strategy. Every live engine on this site inherits that same rigour, the difference is speed, not method.

Full pre-AI archive available on request
Decision intelligence · live

Not one model. A council I direct.

Four models advise. I set the brief, weigh the disagreement, and make the call.
Oriol · the brief
Claude · synthesiser

ChatGPT · model 02

Gemini · model 03

Grok · model 04

Decision · synthesis layer
synthesising

Oriol Cervantes

Send the decision. Get the stress-test back.

One brief, one decision, async. You get back a visual decision product with its evidence drawer open: what the recommendation rests on, where it breaks, and what I would want to know before signing it.

FormatWritten brief, no meetings required
DeliverableInteractive stress-test + one-page verdict
Turnaround48 hours for the first read, five days for the model
Send your decision →

Also open to conversations about leading AI and decision-intelligence functions.

Disclaimers

Method, not real data. The interactive engines on this page are demonstrations of method. Their figures, datasets and scenarios are stylised or illustrative, they do not reproduce confidential client data, nor any third party's proprietary estimates.

Imagery. Every generative image is original work, art-directed in-house. No stock.

Track record. Entries summarise work delivered under confidentiality; institutions, figures and outcomes are described at a level that preserves it, and are shared in a personal capacity.

Sources

Per-claim provenance. Each line in the track record carries its own evidence marker, open it to see the source and its tier.

Tiers  ·  Official, institutional records   /   Verified, corroborated   /   Indicative, estimated.

Interactive demos. Run on synthetic or public-shaped data generated purely for illustration; no underlying confidential figures are exposed.

Contact. Specific methodology notes available on request.